Written by Jane Hames
If you use Excel to summarise and analyse data with pivottables, there may be some very useful options that you haven’t yet discovered (because they are fairly well hidden!). One such feature is the PivotTable Report Pages option. If you are using a report filter (you will have a field name in the Report Filters/Filters part of the pivottable layout box, you have the ability to filter the pivottable without having to show that field in the pivottable itself. See example below: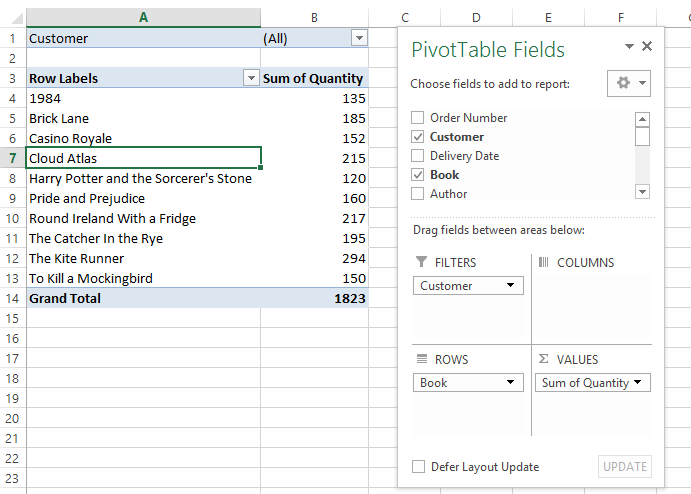
In my example, as shown above, I would like to have a separate worksheet with its own pivottable for each of my customers. The Show Report Filter Pages options will do this in a flash! Here’s how:
- Ensure that you are clicked into the pivottable.
- From the Analyze tab (or pre-2013, use the Options tab) on the ribbon, select the arrow next to the Options button.
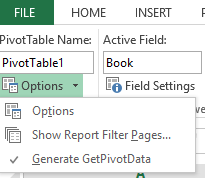
- Select Show Report Filter Pages and click on the field you will be using.
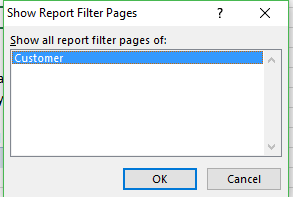
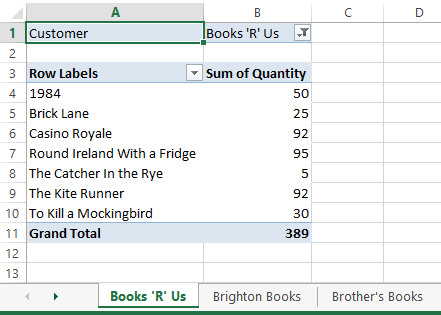
- When you click OK, a new worksheet will be created for each of your items in that field. In my example, I get a new worksheet with a pivottable for each customer.
If you would like to learn how to use PivotTables from scratch or just to learn more about Excel please do get in touch.